
Michigan Housing Market Report: Q1 2026
Sales, prices, inventory and days on market for January through March 2026, with comparisons to prior quarters. Published by Eric Roebuck, Offer Now Michigan. Updated June 2026.
I buy houses across Michigan, so I track these numbers every single week. Each quarter I pull the latest sales data from Redfin and the listing data that Realtor.com publishes through the St. Louis Fed, and I put it all in one place so you can see exactly where our market stands.
The Q1 2026 story: prices held, but the market kept slowing
Three things stood out to me this quarter.
First, prices are still grinding higher year over year. The statewide median sale price came in at $260,500 for the quarter, up 3.3% from $252,267 in Q1 2025. That is a slower pace of growth than we saw in 2024 and 2025, but it is still growth. Sellers who heard the market is crashing should look at that number first.
Second, the pace of sales kept cooling. Just under 21,000 homes changed hands statewide this quarter, the slowest quarter in this entire dataset and 5.9% fewer than the same period last year. The typical home took 48 days to go under contract, nearly 5 days longer than Q1 2025 and the slowest reading in three years.
Third, supply is finally rebuilding. Months of supply hit 3.1, the highest level in this dataset, and active listings averaged 18,286, up 9.5% from a year ago. Only 25% of Michigan homes sold above their list price this quarter. Two years ago that figure was over 30%. Buyers have more choices and more leverage than they have had at any point since 2022, and the data shows it: the average home sold at 97.6% of list price.
Median sale price trend
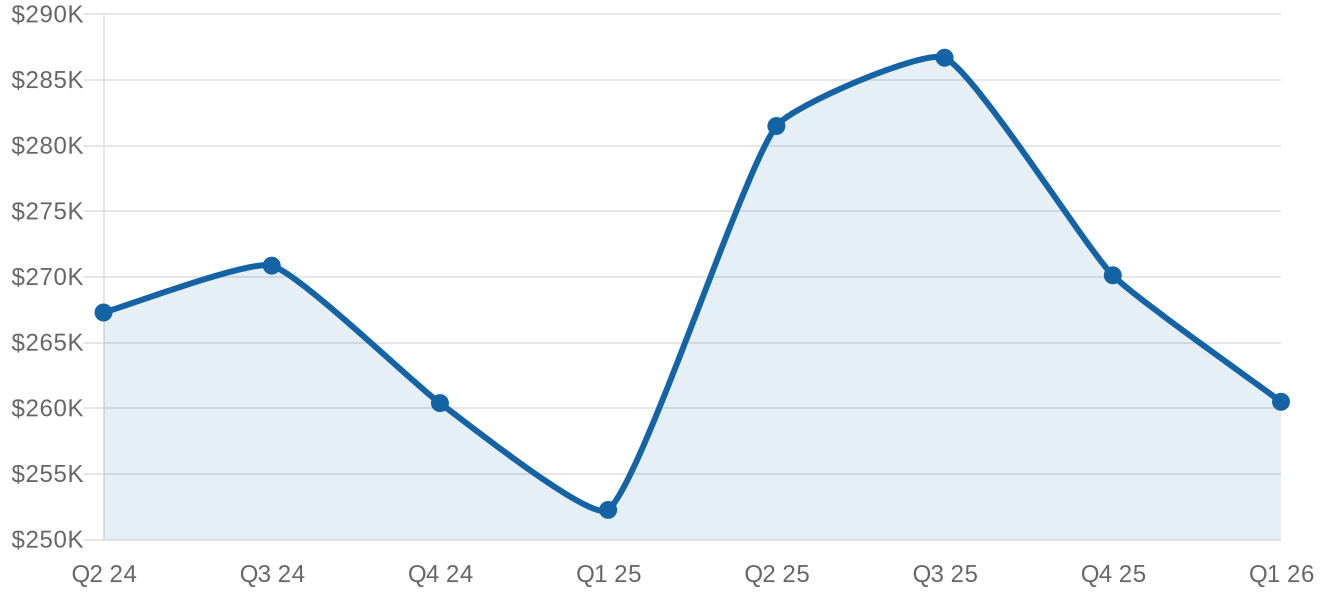
Statewide median sale price, all residential. Source: Redfin Data Center, quarterly average of monthly values.
Homes sold by quarter
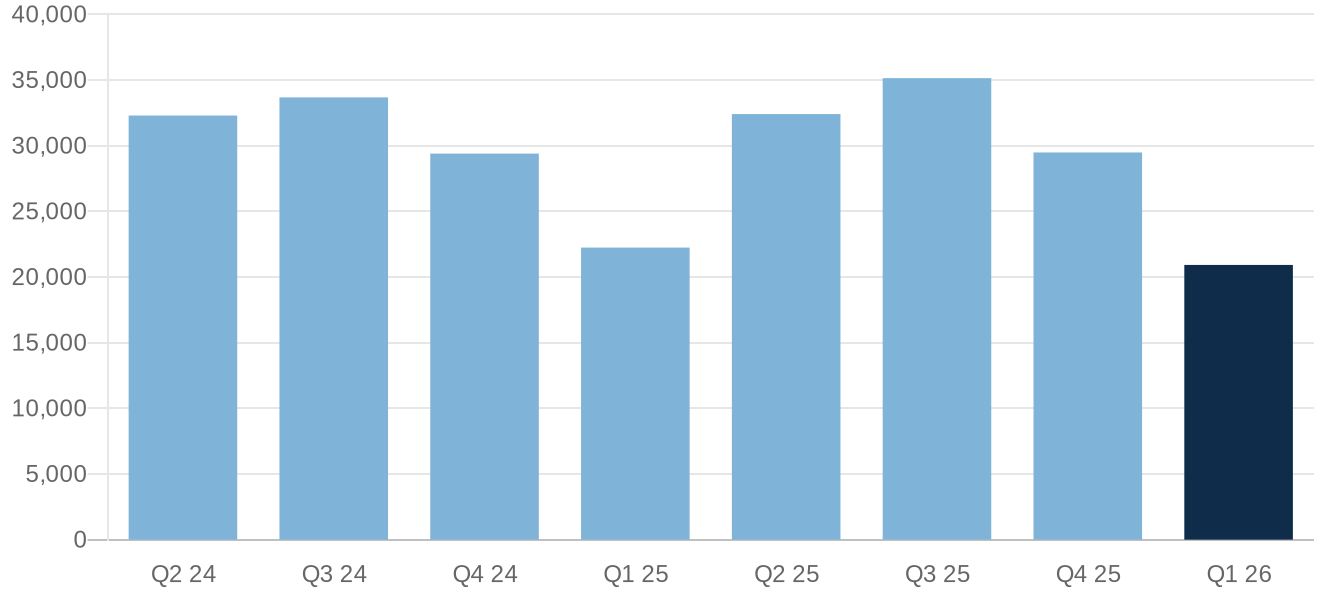
Total closed sales statewide per quarter. Source: Redfin Data Center.
Every metric, every quarter
| Quarter | Median sale price | Homes sold | Days on market | Months supply | Sold above list | Sale to list |
|---|---|---|---|---|---|---|
| Q1 2023 | $219,067 | 23,535 | 39 | 2.3 | 27.5% | 97.8% |
| Q2 2023 | $251,433 | 31,973 | 20 | 1.8 | 44.4% | 100.3% |
| Q3 2023 | $255,500 | 33,951 | 21 | 2.0 | 41.7% | 99.9% |
| Q4 2023 | $238,167 | 28,080 | 28 | 2.2 | 32.2% | 98.4% |
| Q1 2024 | $237,500 | 22,681 | 36 | 2.3 | 30.1% | 98.3% |
| Q2 2024 | $267,300 | 32,297 | 22 | 2.0 | 42.0% | 99.9% |
| Q3 2024 | $270,867 | 33,681 | 25 | 2.3 | 36.7% | 99.2% |
| Q4 2024 | $260,400 | 29,400 | 34 | 2.5 | 28.3% | 98.0% |
| Q1 2025 | $252,267 | 22,243 | 43 | 2.7 | 26.8% | 97.8% |
| Q2 2025 | $281,500 | 32,410 | 25 | 2.3 | 37.7% | 99.3% |
| Q3 2025 | $286,700 | 35,148 | 28 | 2.5 | 33.1% | 98.7% |
| Q4 2025 | $270,133 | 29,485 | 37 | 2.7 | 26.3% | 97.8% |
| Q1 2026 | $260,500 | 20,921 | 48 | 3.1 | 25.0% | 97.6% |
All residential properties, not seasonally adjusted. Price and ratio figures are quarterly averages of Redfin monthly data. Homes sold is the quarterly total.
How each Michigan metro did in Q1 2026
Statewide numbers hide a lot. Kalamazoo and Traverse City posted double digit price gains while Lansing and Saginaw were nearly flat. Every metro I track slowed down on sales volume. Here is the breakdown.
| Metro area | Median sale price | Change vs Q1 2025 | Homes sold | Days on market |
|---|---|---|---|---|
| Detroit | $185,317 | up 4.8% | 3,693 | 44 |
| Warren / Troy / Farmington Hills | $305,000 | up 4.3% | 5,719 | 40 |
| Grand Rapids | $340,908 | up 4.1% | 2,216 | 26 |
| Ann Arbor | $392,067 | up 2.1% | 600 | 58 |
| Lansing | $211,633 | up 0.9% | 1,126 | 49 |
| Flint | $197,833 | up 4.1% | 938 | 42 |
| Kalamazoo | $282,467 | up 11.2% | 548 | 34 |
| Saginaw | $163,300 | up 1.0% | 389 | 45 |
| Traverse City | $405,667 | up 11.3% | 461 | 75 |
| Monroe | $258,133 | up 5.9% | 298 | 53 |
Source: Redfin Data Center metro level tracker, all residential, quarterly averages. Homes sold is the quarterly total.
The listing side: what sellers were asking
The numbers above are closed sales. The listing data shows what sellers were doing at the same time. Active listings averaged 18,286 in Q1 2026, up 9.5% from 16,698 a year earlier. The median asking price was $271,283, roughly $10,783 above the $260,500 median price homes actually sold for. An average of 4,489 listings per month took a price reduction during the quarter, up 5.0% year over year, and the median asking price per square foot was $177.
What this means if you are selling in 2026
The market is not crashing, but it has changed. Prices are up modestly year over year while everything else got slower: fewer sales, longer time on market, more competition from other sellers, and three quarters of homes now selling at or below asking. If your house is updated and priced right, it will still sell. If it needs work, the pool of buyers willing to take it on at retail keeps shrinking, and 48 days is just the median wait. Houses that need repairs routinely sit much longer.
That second group is who we work with. If you would rather skip the listing process entirely, we make cash offers on Michigan houses in any condition and can close on your timeline. Either way, I will keep publishing these numbers every quarter so you can make the call with real data. The full series lives at our Michigan housing market data hub.
Sources and methodology
Sale side figures (median sale price, homes sold, days on market, months of supply, sale to list) are computed from the Redfin Data Center state and metro market trackers, all residential properties, not seasonally adjusted. Listing side figures (active listings, new listings, price reductions, asking price per square foot) come from Realtor.com residential listing data published via FRED, Federal Reserve Bank of St. Louis. Quarterly values are averages of the three monthly readings, except homes sold which is the quarterly sum. Data retrieved June 2026. Next update: the Q2 2026 report arrives in July 2026.