
Michigan Housing Market Report: Q4 2025
Sales, prices, inventory and days on market for October through December 2025, with comparisons to prior quarters. Published by Eric Roebuck, Offer Now Michigan. Updated June 2026.
I buy houses across Michigan, so I track these numbers every single week. Each quarter I pull the latest sales data from Redfin and the listing data that Realtor.com publishes through the St. Louis Fed, and I put it all in one place so you can see exactly where our market stands.
The Q4 2025 story: growth shifts into a lower gear
The deceleration became unmistakable in late 2025. The statewide median sale price came in at $270,133, up 3.7% year over year. That is healthy, but it was the slowest annual growth in two years, down from the 9.3% pace of the prior Q4.
Sales were flat at 29,485 closings. The typical home took 37 days to go under contract, and only 26.3% of homes sold above their asking price. The average sale closed at 97.8% of list.
Inventory finished the year at a series high for a fourth quarter, with active listings averaging 24,036, up 11.6% year over year. That overhang set up the slow start to 2026 you can see in the next report.
Median sale price trend
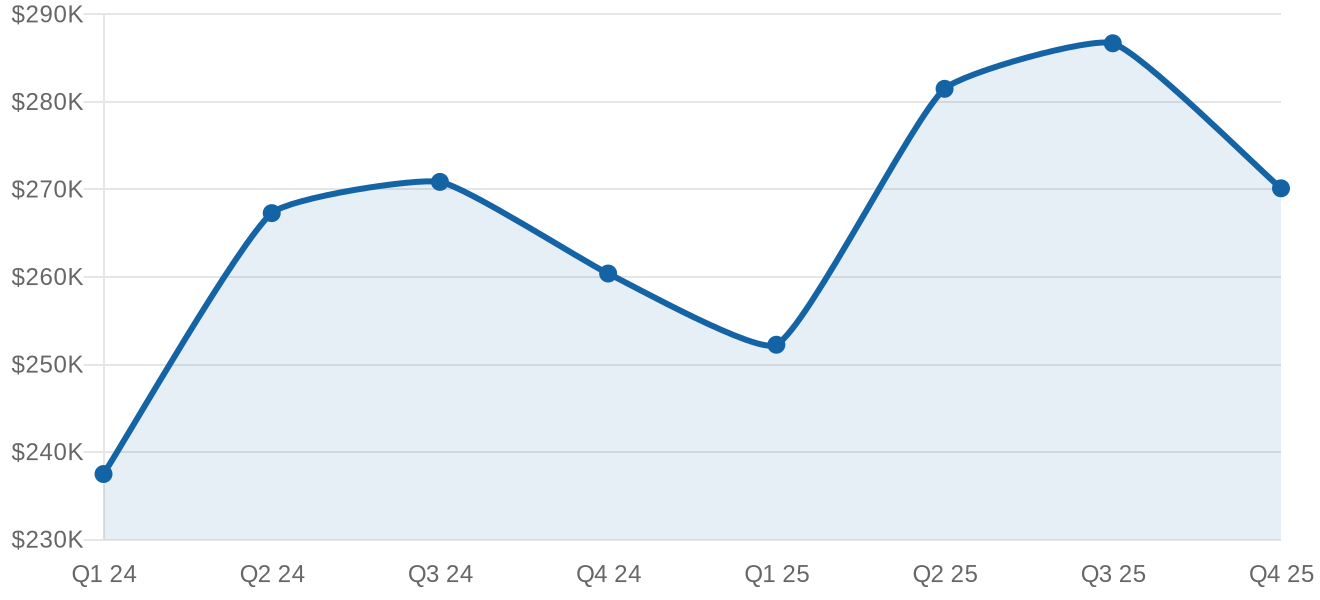
Statewide median sale price, all residential. Source: Redfin Data Center, quarterly average of monthly values.
Homes sold by quarter
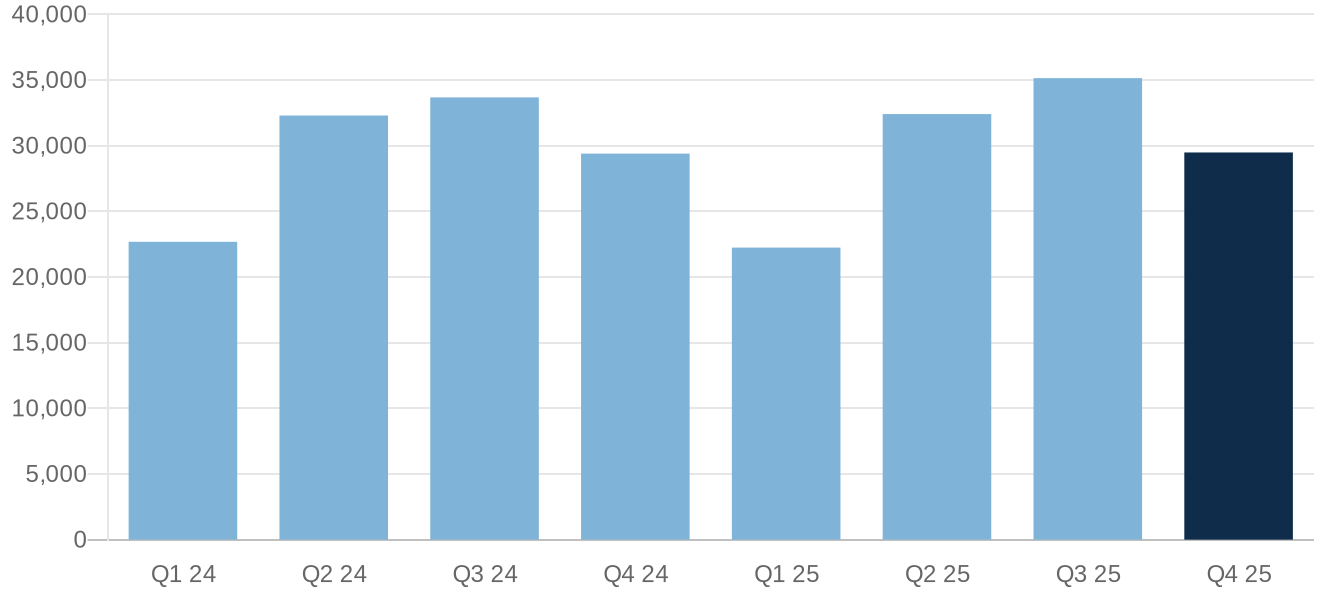
Total closed sales statewide per quarter. Source: Redfin Data Center.
Every metric, every quarter
| Quarter | Median sale price | Homes sold | Days on market | Months supply | Sold above list | Sale to list |
|---|---|---|---|---|---|---|
| Q1 2023 | $219,067 | 23,535 | 39 | 2.3 | 27.5% | 97.8% |
| Q2 2023 | $251,433 | 31,973 | 20 | 1.8 | 44.4% | 100.3% |
| Q3 2023 | $255,500 | 33,951 | 21 | 2.0 | 41.7% | 99.9% |
| Q4 2023 | $238,167 | 28,080 | 28 | 2.2 | 32.2% | 98.4% |
| Q1 2024 | $237,500 | 22,681 | 36 | 2.3 | 30.1% | 98.3% |
| Q2 2024 | $267,300 | 32,297 | 22 | 2.0 | 42.0% | 99.9% |
| Q3 2024 | $270,867 | 33,681 | 25 | 2.3 | 36.7% | 99.2% |
| Q4 2024 | $260,400 | 29,400 | 34 | 2.5 | 28.3% | 98.0% |
| Q1 2025 | $252,267 | 22,243 | 43 | 2.7 | 26.8% | 97.8% |
| Q2 2025 | $281,500 | 32,410 | 25 | 2.3 | 37.7% | 99.3% |
| Q3 2025 | $286,700 | 35,148 | 28 | 2.5 | 33.1% | 98.7% |
| Q4 2025 | $270,133 | 29,485 | 37 | 2.7 | 26.3% | 97.8% |
All residential properties, not seasonally adjusted. Price and ratio figures are quarterly averages of Redfin monthly data. Homes sold is the quarterly total.
How each Michigan metro did in Q4 2025
Metro results for the quarter are below.
| Metro area | Median sale price | Change vs Q4 2024 | Homes sold | Days on market |
|---|---|---|---|---|
| Detroit | $199,667 | up 7.2% | 4,716 | 32 |
| Warren / Troy / Farmington Hills | $314,167 | up 2.2% | 7,815 | 31 |
| Grand Rapids | $344,633 | up 4.3% | 3,132 | 18 |
| Ann Arbor | $403,833 | up 1.6% | 852 | 48 |
| Lansing | $231,000 | up 5.9% | 1,567 | 42 |
| Flint | $208,333 | up 4.5% | 1,261 | 31 |
| Kalamazoo | $273,000 | up 6.8% | 725 | 20 |
| Saginaw | $162,983 | down 4.2% | 533 | 29 |
| Traverse City | $413,567 | down 0.1% | 759 | 63 |
| Monroe | $260,237 | up 6.9% | 435 | 37 |
Source: Redfin Data Center metro level tracker, all residential, quarterly averages. Homes sold is the quarterly total.
The listing side: what sellers were asking
The numbers above are closed sales. The listing data shows what sellers were doing at the same time. Active listings averaged 24,036 in Q4 2025, up 11.6% from 21,531 a year earlier. The median asking price was $286,800, roughly $16,667 above the $270,133 median price homes actually sold for. An average of 7,880 listings per month took a price reduction during the quarter, up 16.5% year over year, and the median asking price per square foot was $179.
What this meant if you were selling
By late 2025 the market had two clear rules: price realistically or sit. Homes that chased early 2025 prices collected days on market instead of offers. The whole series is at our Michigan housing market data hub, and when a 37 day wait plus financing risk is the dealbreaker, Offer Now Michigan closes with cash on your timeline.
Sources and methodology
Sale side figures (median sale price, homes sold, days on market, months of supply, sale to list) are computed from the Redfin Data Center state and metro market trackers, all residential properties, not seasonally adjusted. Listing side figures (active listings, new listings, price reductions, asking price per square foot) come from Realtor.com residential listing data published via FRED, Federal Reserve Bank of St. Louis. Quarterly values are averages of the three monthly readings, except homes sold which is the quarterly sum. Data retrieved June 2026.