
Michigan Housing Market Report: Q3 2025
Sales, prices, inventory and days on market for July through September 2025, with comparisons to prior quarters. Published by Eric Roebuck, Offer Now Michigan. Updated June 2026.
I buy houses across Michigan, so I track these numbers every single week. Each quarter I pull the latest sales data from Redfin and the listing data that Realtor.com publishes through the St. Louis Fed, and I put it all in one place so you can see exactly where our market stands.
The Q3 2025 story: the peak of the cycle so far
The third quarter of 2025 set two records in this dataset at once. The statewide median sale price hit $286,700, the highest of any quarter in the series, up 5.8% year over year. And 35,148 homes changed hands, the busiest quarter in the series.
The catch is that the supply side set records too. An average of 9,961 listings per month took a price cut, up 17.4% from the prior year and the most in this dataset. Active listings averaged 24,342, up 15.3% and also a series high. One out of every three homes still sold above asking, but the average sale closed at 98.7% of list, not above it.
This is what a market top tends to look like in the data: record prices, record activity, and record discounting all at the same time.
Median sale price trend
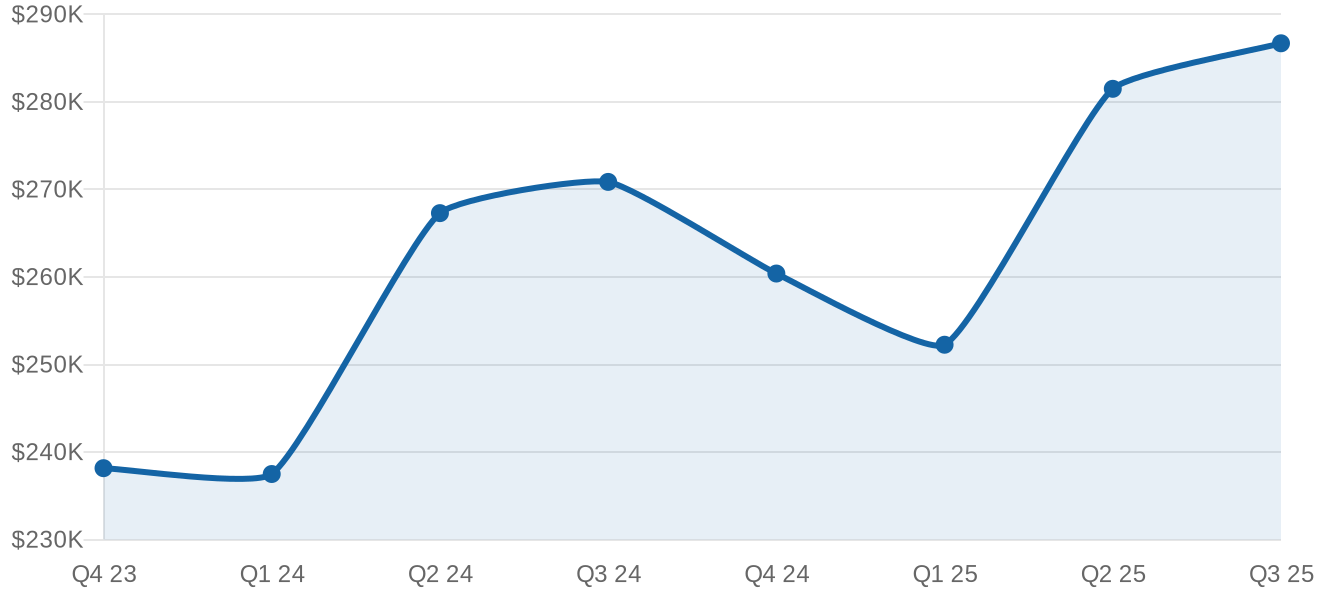
Statewide median sale price, all residential. Source: Redfin Data Center, quarterly average of monthly values.
Homes sold by quarter
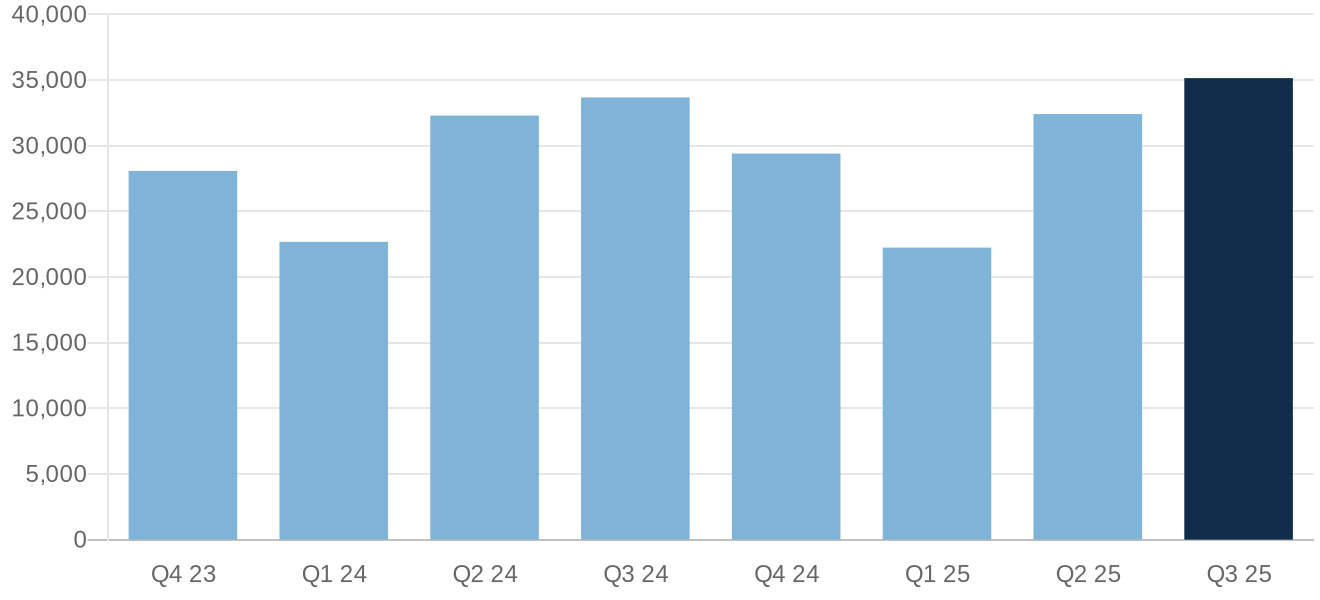
Total closed sales statewide per quarter. Source: Redfin Data Center.
Every metric, every quarter
| Quarter | Median sale price | Homes sold | Days on market | Months supply | Sold above list | Sale to list |
|---|---|---|---|---|---|---|
| Q1 2023 | $219,067 | 23,535 | 39 | 2.3 | 27.5% | 97.8% |
| Q2 2023 | $251,433 | 31,973 | 20 | 1.8 | 44.4% | 100.3% |
| Q3 2023 | $255,500 | 33,951 | 21 | 2.0 | 41.7% | 99.9% |
| Q4 2023 | $238,167 | 28,080 | 28 | 2.2 | 32.2% | 98.4% |
| Q1 2024 | $237,500 | 22,681 | 36 | 2.3 | 30.1% | 98.3% |
| Q2 2024 | $267,300 | 32,297 | 22 | 2.0 | 42.0% | 99.9% |
| Q3 2024 | $270,867 | 33,681 | 25 | 2.3 | 36.7% | 99.2% |
| Q4 2024 | $260,400 | 29,400 | 34 | 2.5 | 28.3% | 98.0% |
| Q1 2025 | $252,267 | 22,243 | 43 | 2.7 | 26.8% | 97.8% |
| Q2 2025 | $281,500 | 32,410 | 25 | 2.3 | 37.7% | 99.3% |
| Q3 2025 | $286,700 | 35,148 | 28 | 2.5 | 33.1% | 98.7% |
All residential properties, not seasonally adjusted. Price and ratio figures are quarterly averages of Redfin monthly data. Homes sold is the quarterly total.
How each Michigan metro did in Q3 2025
The metro numbers below show how broad the activity was.
| Metro area | Median sale price | Change vs Q3 2024 | Homes sold | Days on market |
|---|---|---|---|---|
| Detroit | $213,333 | up 5.3% | 5,208 | 23 |
| Warren / Troy / Farmington Hills | $333,854 | up 4.4% | 9,571 | 22 |
| Grand Rapids | $355,333 | up 4.9% | 3,751 | 12 |
| Ann Arbor | $436,333 | up 7.1% | 1,030 | 39 |
| Lansing | $239,150 | up 10.5% | 1,736 | 33 |
| Flint | $225,650 | up 8.1% | 1,479 | 24 |
| Kalamazoo | $286,467 | up 4.1% | 903 | 16 |
| Saginaw | $190,450 | up 7.7% | 574 | 19 |
| Traverse City | $416,333 | down 4.2% | 940 | 54 |
| Monroe | $265,117 | up 5.5% | 475 | 29 |
Source: Redfin Data Center metro level tracker, all residential, quarterly averages. Homes sold is the quarterly total.
The listing side: what sellers were asking
The numbers above are closed sales. The listing data shows what sellers were doing at the same time. Active listings averaged 24,342 in Q3 2025, up 15.3% from 21,119 a year earlier. The median asking price was $305,617, roughly $18,917 above the $286,700 median price homes actually sold for. An average of 9,961 listings per month took a price reduction during the quarter, up 17.4% year over year, and the median asking price per square foot was $185.
What this meant if you were selling
Summer 2025 was the best selling window of the past two years, and the data says many owners knew it, given the record listing counts. Sellers who missed it ran into the slower quarters that followed. You can compare every quarter at our Michigan housing market data hub, and if you want certainty instead of a market timing bet, we make cash offers on Michigan houses year round.
Sources and methodology
Sale side figures (median sale price, homes sold, days on market, months of supply, sale to list) are computed from the Redfin Data Center state and metro market trackers, all residential properties, not seasonally adjusted. Listing side figures (active listings, new listings, price reductions, asking price per square foot) come from Realtor.com residential listing data published via FRED, Federal Reserve Bank of St. Louis. Quarterly values are averages of the three monthly readings, except homes sold which is the quarterly sum. Data retrieved June 2026.