
Michigan Housing Market Report: Q2 2025
Sales, prices, inventory and days on market for April through June 2025, with comparisons to prior quarters. Published by Eric Roebuck, Offer Now Michigan. Updated June 2026.
I buy houses across Michigan, so I track these numbers every single week. Each quarter I pull the latest sales data from Redfin and the listing data that Realtor.com publishes through the St. Louis Fed, and I put it all in one place so you can see exactly where our market stands.
The Q2 2025 story: a record spring with a split personality
Spring 2025 set a new high for Michigan home prices. The statewide median reached $281,500, up 5.3% from the prior spring. Updated homes in good locations still drew crowds, with 37.7% of sales closing above asking.
But this was a two speed market. While the best homes flew, an average of 6,697 listings per month took a price reduction, up 25.9% year over year. Active listings averaged 19,564, up 21.2%. The gap between homes that show well and homes that need work kept widening.
Volume told the same flat story as the rest of this period: 32,410 closings, almost exactly even with spring 2024. Demand was steady, not surging. It was supply doing the moving.
Median sale price trend
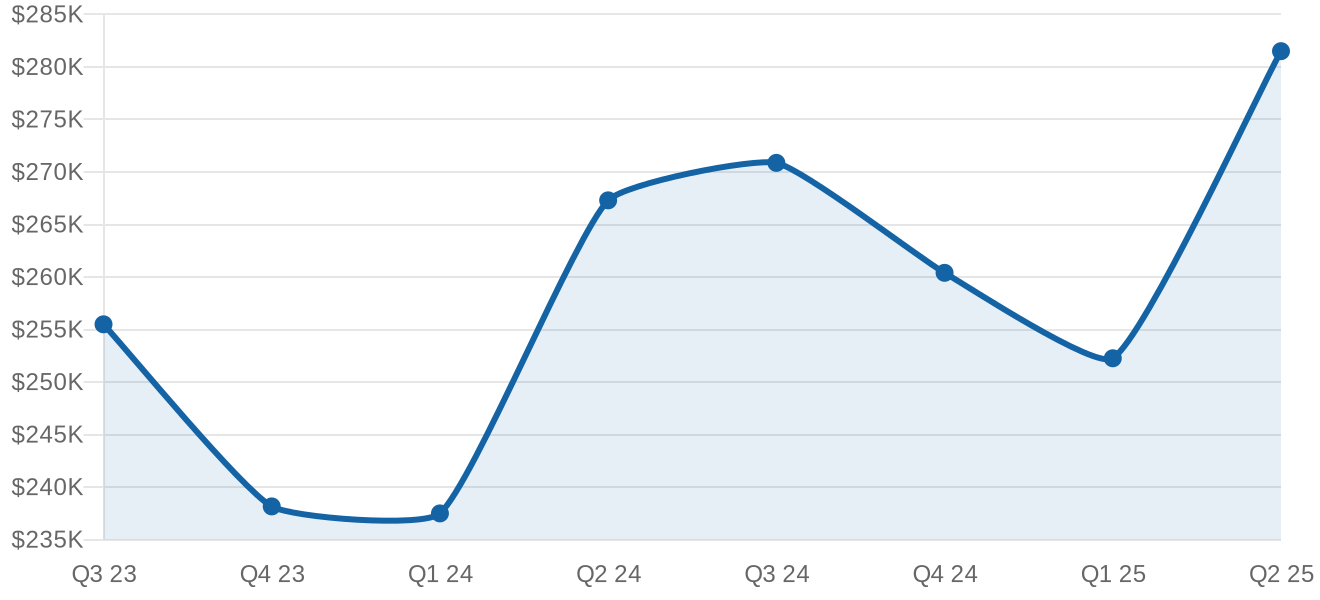
Statewide median sale price, all residential. Source: Redfin Data Center, quarterly average of monthly values.
Homes sold by quarter
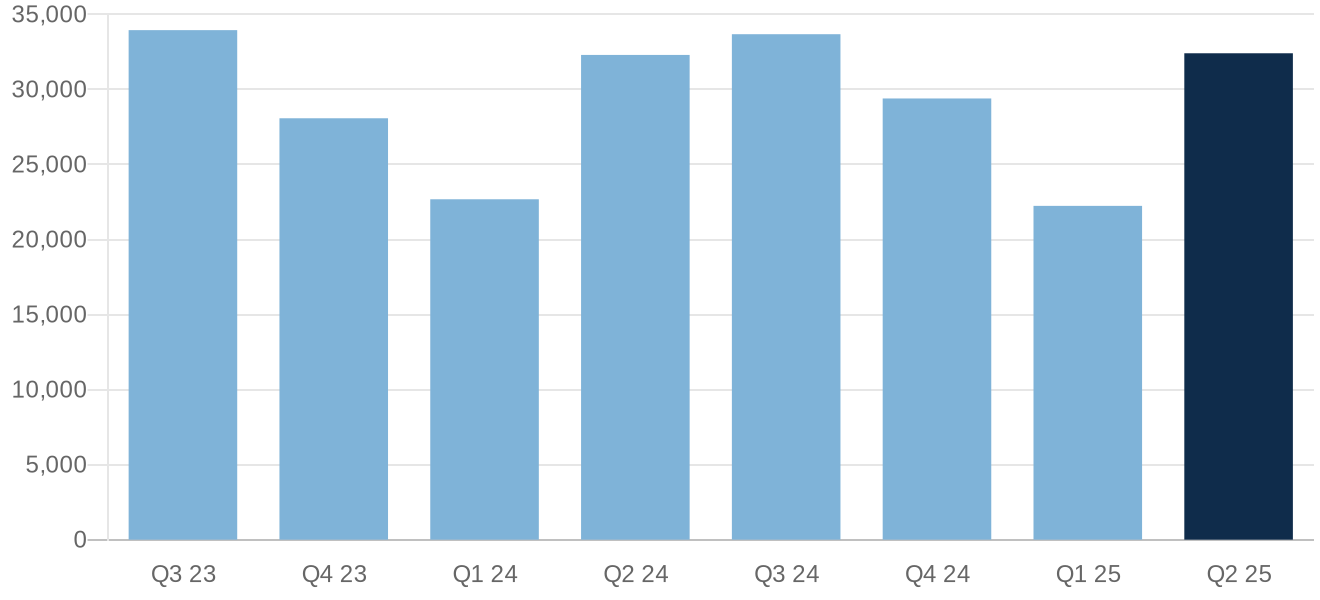
Total closed sales statewide per quarter. Source: Redfin Data Center.
Every metric, every quarter
| Quarter | Median sale price | Homes sold | Days on market | Months supply | Sold above list | Sale to list |
|---|---|---|---|---|---|---|
| Q1 2023 | $219,067 | 23,535 | 39 | 2.3 | 27.5% | 97.8% |
| Q2 2023 | $251,433 | 31,973 | 20 | 1.8 | 44.4% | 100.3% |
| Q3 2023 | $255,500 | 33,951 | 21 | 2.0 | 41.7% | 99.9% |
| Q4 2023 | $238,167 | 28,080 | 28 | 2.2 | 32.2% | 98.4% |
| Q1 2024 | $237,500 | 22,681 | 36 | 2.3 | 30.1% | 98.3% |
| Q2 2024 | $267,300 | 32,297 | 22 | 2.0 | 42.0% | 99.9% |
| Q3 2024 | $270,867 | 33,681 | 25 | 2.3 | 36.7% | 99.2% |
| Q4 2024 | $260,400 | 29,400 | 34 | 2.5 | 28.3% | 98.0% |
| Q1 2025 | $252,267 | 22,243 | 43 | 2.7 | 26.8% | 97.8% |
| Q2 2025 | $281,500 | 32,410 | 25 | 2.3 | 37.7% | 99.3% |
All residential properties, not seasonally adjusted. Price and ratio figures are quarterly averages of Redfin monthly data. Homes sold is the quarterly total.
How each Michigan metro did in Q2 2025
Here is how the metros split.
| Metro area | Median sale price | Change vs Q2 2024 | Homes sold | Days on market |
|---|---|---|---|---|
| Detroit | $207,400 | up 5.6% | 5,247 | 20 |
| Warren / Troy / Farmington Hills | $325,017 | up 3.8% | 8,844 | 16 |
| Grand Rapids | $355,300 | up 3.2% | 3,559 | 9 |
| Ann Arbor | $421,150 | up 3.3% | 1,192 | 35 |
| Lansing | $231,667 | up 3.9% | 1,696 | 31 |
| Flint | $209,167 | down 1.8% | 1,310 | 23 |
| Kalamazoo | $283,208 | up 2.5% | 867 | 13 |
| Saginaw | $178,250 | up 5.3% | 582 | 18 |
| Traverse City | $437,233 | up 5.1% | 787 | 46 |
| Monroe | $268,333 | up 8.7% | 471 | 23 |
Source: Redfin Data Center metro level tracker, all residential, quarterly averages. Homes sold is the quarterly total.
The listing side: what sellers were asking
The numbers above are closed sales. The listing data shows what sellers were doing at the same time. Active listings averaged 19,564 in Q2 2025, up 21.2% from 16,138 a year earlier. The median asking price was $302,133, roughly $20,633 above the $281,500 median price homes actually sold for. An average of 6,697 listings per month took a price reduction during the quarter, up 25.9% year over year, and the median asking price per square foot was $184.
What this meant if you were selling
If your house was turnkey in spring 2025, you did very well. If it needed a roof or a kitchen, the retail market was quietly getting harder, and the price cut data proves it. The full picture is at our Michigan housing market data hub. For houses in the second category, Offer Now Michigan exists precisely so you do not have to fix anything first.
Sources and methodology
Sale side figures (median sale price, homes sold, days on market, months of supply, sale to list) are computed from the Redfin Data Center state and metro market trackers, all residential properties, not seasonally adjusted. Listing side figures (active listings, new listings, price reductions, asking price per square foot) come from Realtor.com residential listing data published via FRED, Federal Reserve Bank of St. Louis. Quarterly values are averages of the three monthly readings, except homes sold which is the quarterly sum. Data retrieved June 2026.