
Michigan Housing Market Report: Q1 2025
Sales, prices, inventory and days on market for January through March 2025, with comparisons to prior quarters. Published by Eric Roebuck, Offer Now Michigan. Updated June 2026.
I buy houses across Michigan, so I track these numbers every single week. Each quarter I pull the latest sales data from Redfin and the listing data that Realtor.com publishes through the St. Louis Fed, and I put it all in one place so you can see exactly where our market stands.
The Q1 2025 story: a slow winter with sticky prices
Winter 2025 was sluggish. Only 22,243 homes sold statewide, 1.9% fewer than the prior winter, and the median time to go under contract stretched to 43 days, a full week longer than Q1 2024.
Prices did not care. The statewide median came in at $252,267, up 6.2% year over year. Sellers were asking $266,765 at the median, about $14,500 above what homes actually sold for, which tells you list prices were running ahead of the market.
Supply kept creeping up. Months of supply reached 2.7 and active listings averaged 16,698, up 16.4% from the prior winter. Just 26.8% of homes sold above asking, the lowest share in two years to that point.
Median sale price trend
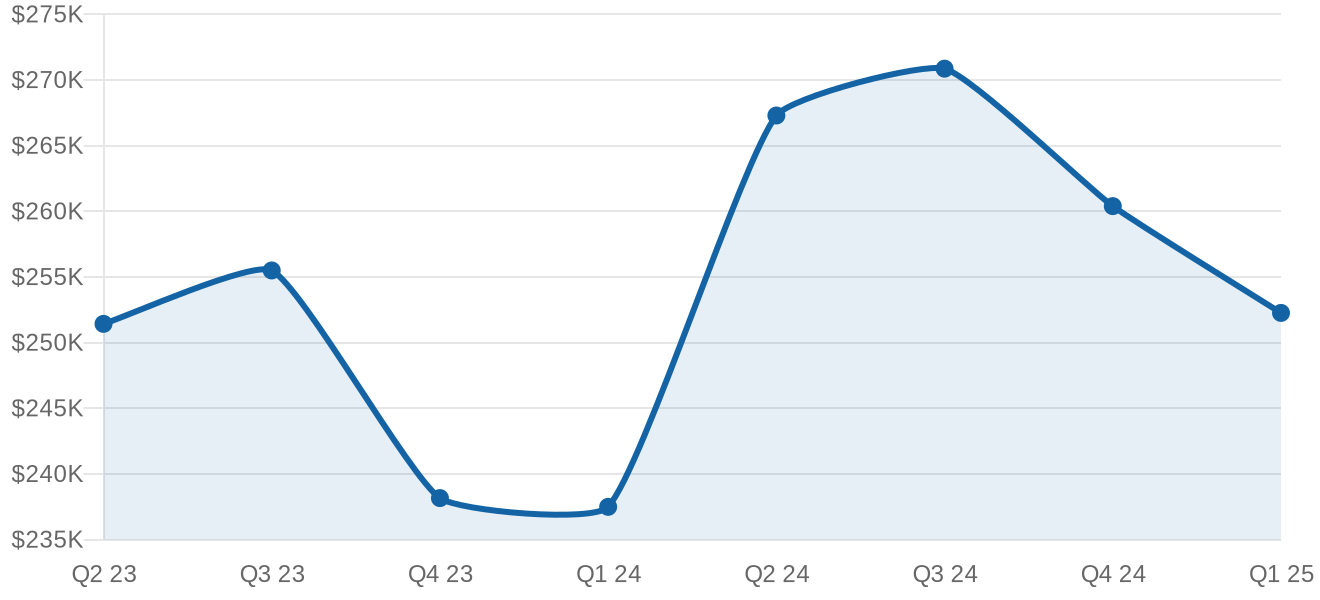
Statewide median sale price, all residential. Source: Redfin Data Center, quarterly average of monthly values.
Homes sold by quarter
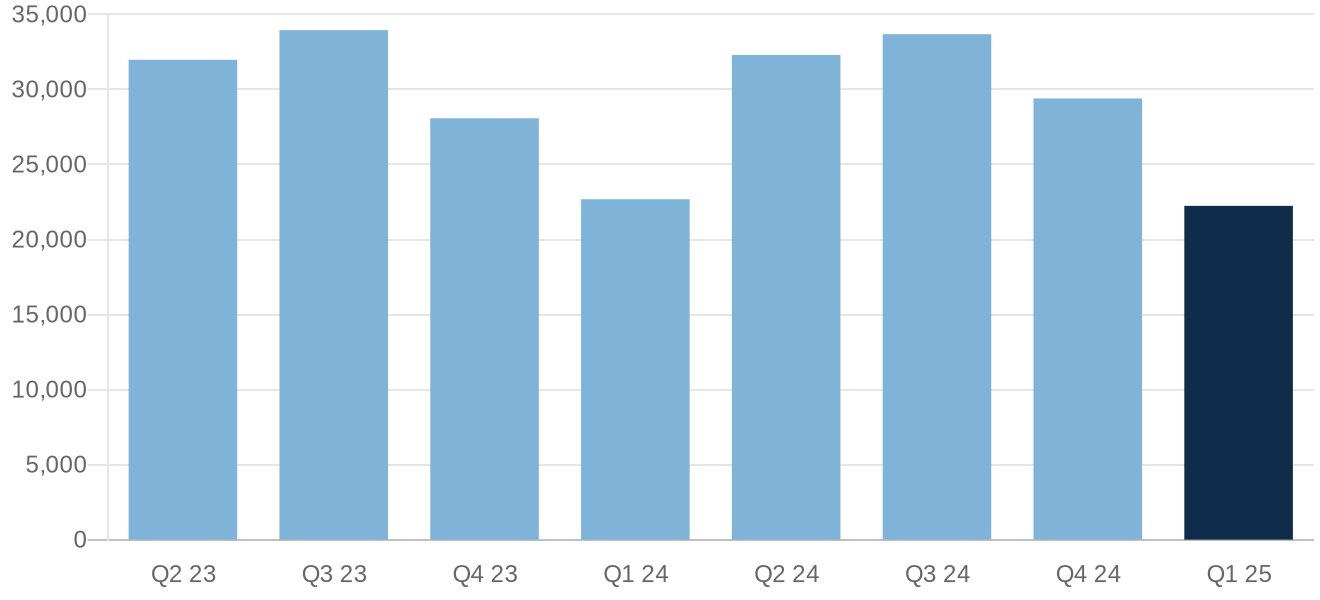
Total closed sales statewide per quarter. Source: Redfin Data Center.
Every metric, every quarter
| Quarter | Median sale price | Homes sold | Days on market | Months supply | Sold above list | Sale to list |
|---|---|---|---|---|---|---|
| Q1 2023 | $219,067 | 23,535 | 39 | 2.3 | 27.5% | 97.8% |
| Q2 2023 | $251,433 | 31,973 | 20 | 1.8 | 44.4% | 100.3% |
| Q3 2023 | $255,500 | 33,951 | 21 | 2.0 | 41.7% | 99.9% |
| Q4 2023 | $238,167 | 28,080 | 28 | 2.2 | 32.2% | 98.4% |
| Q1 2024 | $237,500 | 22,681 | 36 | 2.3 | 30.1% | 98.3% |
| Q2 2024 | $267,300 | 32,297 | 22 | 2.0 | 42.0% | 99.9% |
| Q3 2024 | $270,867 | 33,681 | 25 | 2.3 | 36.7% | 99.2% |
| Q4 2024 | $260,400 | 29,400 | 34 | 2.5 | 28.3% | 98.0% |
| Q1 2025 | $252,267 | 22,243 | 43 | 2.7 | 26.8% | 97.8% |
All residential properties, not seasonally adjusted. Price and ratio figures are quarterly averages of Redfin monthly data. Homes sold is the quarterly total.
How each Michigan metro did in Q1 2025
The metro picture varied widely.
| Metro area | Median sale price | Change vs Q1 2024 | Homes sold | Days on market |
|---|---|---|---|---|
| Detroit | $176,824 | up 5.0% | 3,876 | 36 |
| Warren / Troy / Farmington Hills | $292,550 | up 4.5% | 6,068 | 31 |
| Grand Rapids | $327,417 | up 1.6% | 2,371 | 25 |
| Ann Arbor | $383,917 | up 1.8% | 665 | 47 |
| Lansing | $209,667 | up 7.3% | 1,146 | 49 |
| Flint | $190,000 | up 6.5% | 997 | 45 |
| Kalamazoo | $254,117 | up 2.1% | 565 | 36 |
| Saginaw | $161,667 | up 7.8% | 390 | 35 |
| Traverse City | $364,333 | up 2.3% | 480 | 90 |
| Monroe | $243,647 | up 9.1% | 316 | 44 |
Source: Redfin Data Center metro level tracker, all residential, quarterly averages. Homes sold is the quarterly total.
The listing side: what sellers were asking
The numbers above are closed sales. The listing data shows what sellers were doing at the same time. Active listings averaged 16,698 in Q1 2025, up 16.3% from 14,352 a year earlier. The median asking price was $266,765, roughly $14,498 above the $252,267 median price homes actually sold for. An average of 4,277 listings per month took a price reduction during the quarter, up 18.9% year over year, and the median asking price per square foot was $171.
What this meant if you were selling
Patience became part of the price in early 2025. Homes still appreciated, but the days of naming a number in February and getting it by March were over. Every quarter of this series is at our Michigan housing market data hub, and if waiting 43 days plus closing time does not work for your situation, we buy Michigan houses for cash on a timeline you pick.
Sources and methodology
Sale side figures (median sale price, homes sold, days on market, months of supply, sale to list) are computed from the Redfin Data Center state and metro market trackers, all residential properties, not seasonally adjusted. Listing side figures (active listings, new listings, price reductions, asking price per square foot) come from Realtor.com residential listing data published via FRED, Federal Reserve Bank of St. Louis. Quarterly values are averages of the three monthly readings, except homes sold which is the quarterly sum. Data retrieved June 2026.