
Michigan Housing Market Report: Q4 2024
Sales, prices, inventory and days on market for October through December 2024, with comparisons to prior quarters. Published by Eric Roebuck, Offer Now Michigan. Updated June 2026.
I buy houses across Michigan, so I track these numbers every single week. Each quarter I pull the latest sales data from Redfin and the listing data that Realtor.com publishes through the St. Louis Fed, and I put it all in one place so you can see exactly where our market stands.
The Q4 2024 story: the biggest price jump in the series
The fourth quarter of 2024 posted the largest year over year price gain in this entire dataset. The statewide median hit $260,400, up 9.3% from $238,167 in Q4 2023. Part of that is a base effect, since late 2023 was unusually weak, but it was still a remarkable print for a quarter when mortgage rates stayed elevated.
Sales rose too. With 29,400 closings, volume came in 4.7% ahead of the prior year, the strongest year over year sales growth of 2024. The typical home took about 34 days to go under contract, normal for the season, and 28.3% of homes still sold above asking.
Inventory kept building in the background. Active listings averaged 21,531, up 18.9% from a year earlier. The supply that would reshape 2025 was already on the shelves.
Median sale price trend
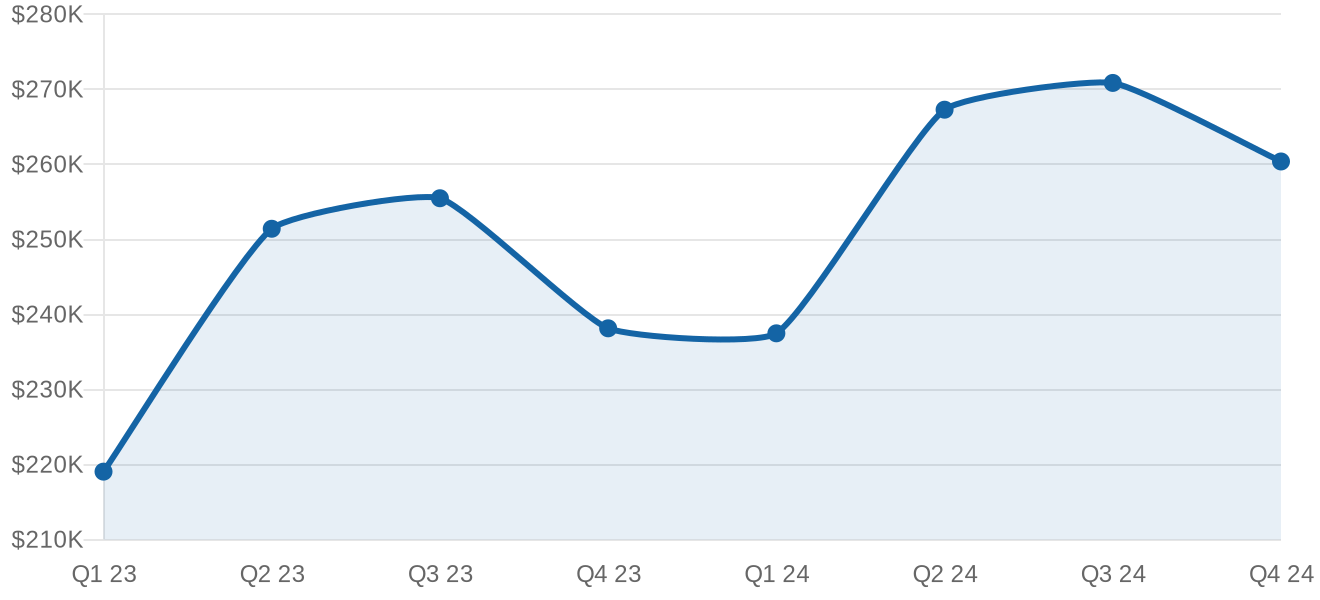
Statewide median sale price, all residential. Source: Redfin Data Center, quarterly average of monthly values.
Homes sold by quarter
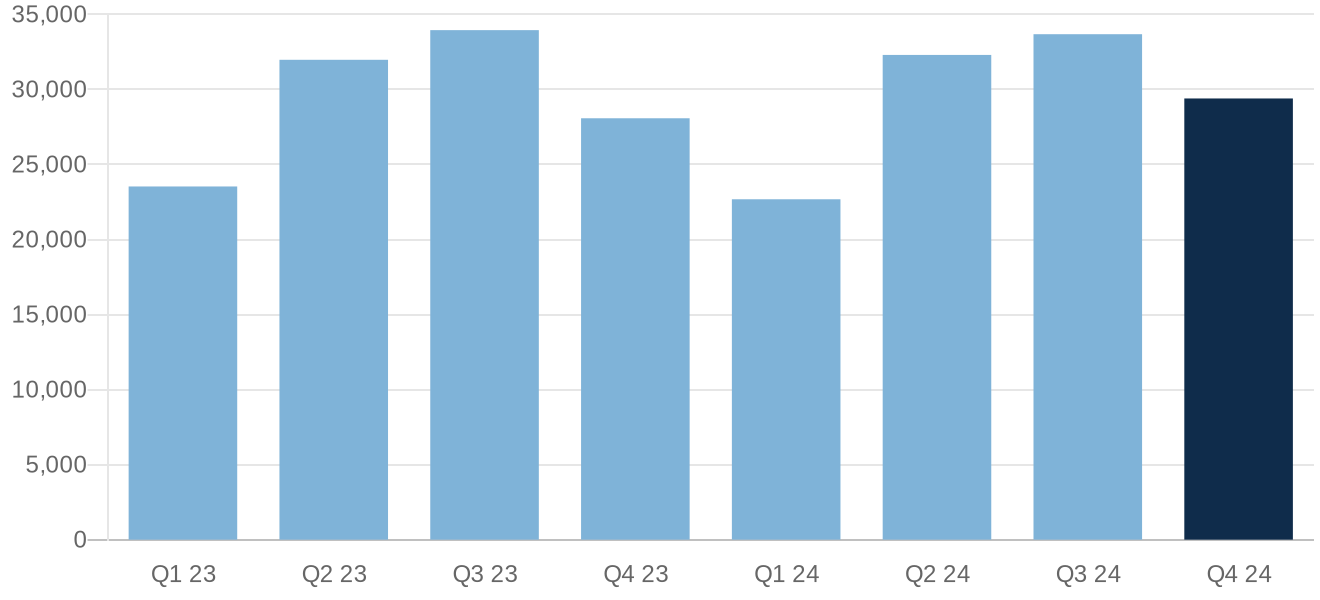
Total closed sales statewide per quarter. Source: Redfin Data Center.
Every metric, every quarter
| Quarter | Median sale price | Homes sold | Days on market | Months supply | Sold above list | Sale to list |
|---|---|---|---|---|---|---|
| Q1 2023 | $219,067 | 23,535 | 39 | 2.3 | 27.5% | 97.8% |
| Q2 2023 | $251,433 | 31,973 | 20 | 1.8 | 44.4% | 100.3% |
| Q3 2023 | $255,500 | 33,951 | 21 | 2.0 | 41.7% | 99.9% |
| Q4 2023 | $238,167 | 28,080 | 28 | 2.2 | 32.2% | 98.4% |
| Q1 2024 | $237,500 | 22,681 | 36 | 2.3 | 30.1% | 98.3% |
| Q2 2024 | $267,300 | 32,297 | 22 | 2.0 | 42.0% | 99.9% |
| Q3 2024 | $270,867 | 33,681 | 25 | 2.3 | 36.7% | 99.2% |
| Q4 2024 | $260,400 | 29,400 | 34 | 2.5 | 28.3% | 98.0% |
All residential properties, not seasonally adjusted. Price and ratio figures are quarterly averages of Redfin monthly data. Homes sold is the quarterly total.
How each Michigan metro did in Q4 2024
Here is the metro breakdown for the quarter.
| Metro area | Median sale price | Change vs Q4 2023 | Homes sold | Days on market |
|---|---|---|---|---|
| Detroit | $186,333 | up 7.2% | 4,992 | 28 |
| Warren / Troy / Farmington Hills | $307,333 | up 10.0% | 8,016 | 27 |
| Grand Rapids | $330,500 | up 7.3% | 3,085 | 19 |
| Ann Arbor | $397,300 | up 12.5% | 869 | 41 |
| Lansing | $218,133 | up 9.0% | 1,431 | 37 |
| Flint | $199,283 | up 10.1% | 1,182 | 33 |
| Kalamazoo | $255,667 | up 3.7% | 717 | 22 |
| Saginaw | $170,133 | up 7.9% | 536 | 27 |
| Traverse City | $414,000 | up 9.0% | 709 | 68 |
| Monroe | $243,333 | up 1.0% | 409 | 36 |
Source: Redfin Data Center metro level tracker, all residential, quarterly averages. Homes sold is the quarterly total.
The listing side: what sellers were asking
The numbers above are closed sales. The listing data shows what sellers were doing at the same time. Active listings averaged 21,531 in Q4 2024, up 18.9% from 18,101 a year earlier. The median asking price was $279,550, roughly $19,150 above the $260,400 median price homes actually sold for. An average of 6,762 listings per month took a price reduction during the quarter, up 15.4% year over year, and the median asking price per square foot was $173.
What this meant if you were selling
Late 2024 rewarded sellers who stayed in the market through the holidays, with prices up sharply and buyers who were serious. The pattern since then has been different, and you can trace it quarter by quarter at our Michigan housing market data hub. And whenever the timing matters more than the last dollar, Offer Now Michigan can close on your schedule.
Sources and methodology
Sale side figures (median sale price, homes sold, days on market, months of supply, sale to list) are computed from the Redfin Data Center state and metro market trackers, all residential properties, not seasonally adjusted. Listing side figures (active listings, new listings, price reductions, asking price per square foot) come from Realtor.com residential listing data published via FRED, Federal Reserve Bank of St. Louis. Quarterly values are averages of the three monthly readings, except homes sold which is the quarterly sum. Data retrieved June 2026.