
Michigan Housing Market Report: Q3 2024
Sales, prices, inventory and days on market for July through September 2024, with comparisons to prior quarters. Published by Eric Roebuck, Offer Now Michigan. Updated June 2026.
I buy houses across Michigan, so I track these numbers every single week. Each quarter I pull the latest sales data from Redfin and the listing data that Realtor.com publishes through the St. Louis Fed, and I put it all in one place so you can see exactly where our market stands.
The Q3 2024 story: the first signs of cooling
Prices held near record territory in the third quarter of 2024. The statewide median came in at $270,867, up 6.0% from $255,500 a year earlier and the highest quarterly figure of 2024.
But underneath the headline number, the market started shifting. The share of homes selling above asking fell from 42% in the spring to 36.7%. Median days on market stretched from 22 to 25. And active listings averaged 21,119, up 23.2% year over year, the biggest inventory jump in this series to that point. An average of 8,484 listings per month took a price cut, far more than the 6,197 monthly average a year earlier.
Sales volume was essentially flat against the prior year at 33,681 closings. Buyers finally had real choices again, and you can see them starting to use that leverage.
Median sale price trend
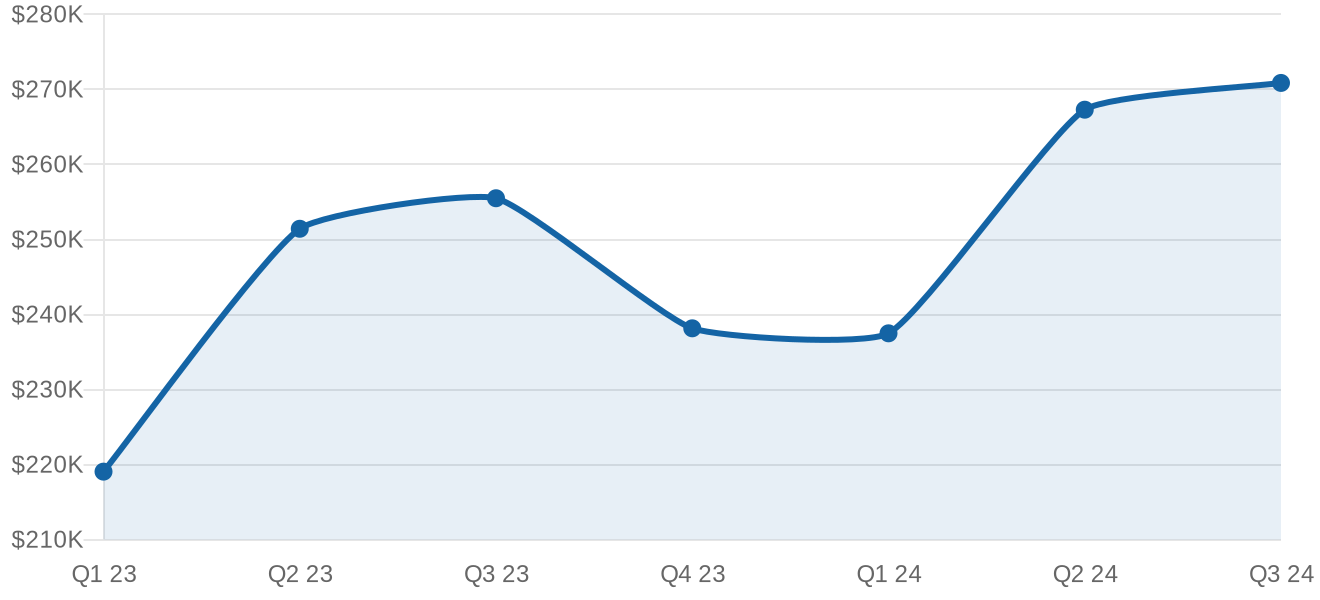
Statewide median sale price, all residential. Source: Redfin Data Center, quarterly average of monthly values.
Homes sold by quarter
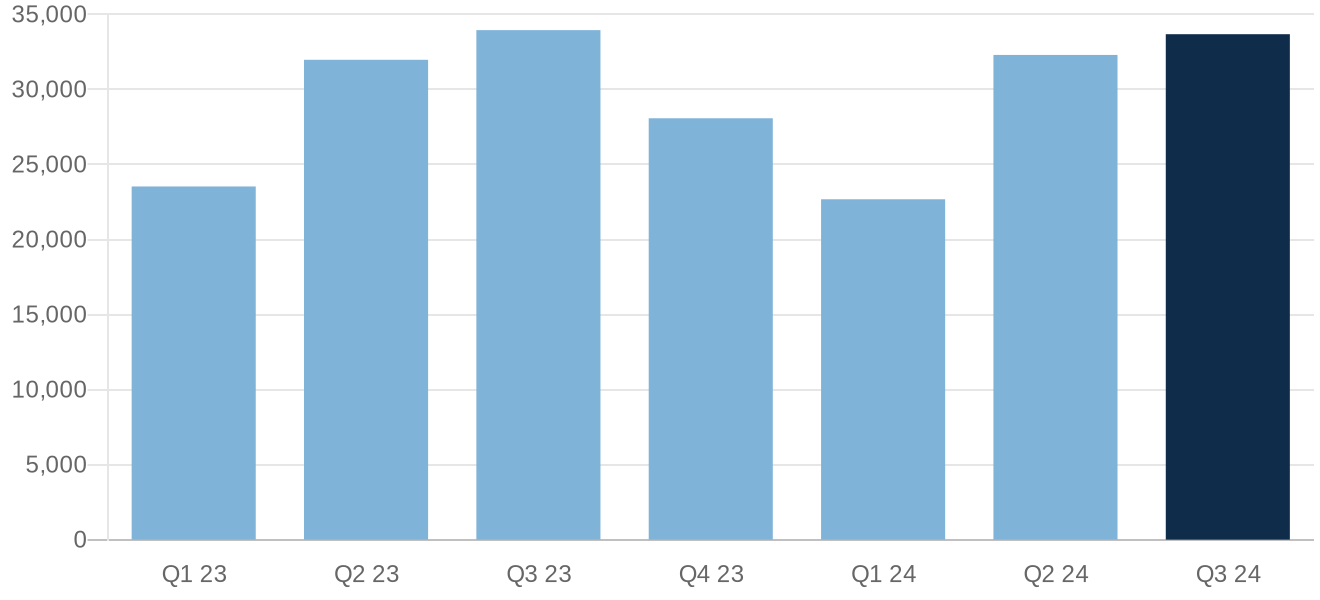
Total closed sales statewide per quarter. Source: Redfin Data Center.
Every metric, every quarter
| Quarter | Median sale price | Homes sold | Days on market | Months supply | Sold above list | Sale to list |
|---|---|---|---|---|---|---|
| Q1 2023 | $219,067 | 23,535 | 39 | 2.3 | 27.5% | 97.8% |
| Q2 2023 | $251,433 | 31,973 | 20 | 1.8 | 44.4% | 100.3% |
| Q3 2023 | $255,500 | 33,951 | 21 | 2.0 | 41.7% | 99.9% |
| Q4 2023 | $238,167 | 28,080 | 28 | 2.2 | 32.2% | 98.4% |
| Q1 2024 | $237,500 | 22,681 | 36 | 2.3 | 30.1% | 98.3% |
| Q2 2024 | $267,300 | 32,297 | 22 | 2.0 | 42.0% | 99.9% |
| Q3 2024 | $270,867 | 33,681 | 25 | 2.3 | 36.7% | 99.2% |
All residential properties, not seasonally adjusted. Price and ratio figures are quarterly averages of Redfin monthly data. Homes sold is the quarterly total.
How each Michigan metro did in Q3 2024
Metro by metro, here is what the quarter looked like.
| Metro area | Median sale price | Change vs Q3 2023 | Homes sold | Days on market |
|---|---|---|---|---|
| Detroit | $202,500 | up 8.9% | 5,251 | 21 |
| Warren / Troy / Farmington Hills | $319,754 | up 7.4% | 9,154 | 18 |
| Grand Rapids | $338,667 | up 4.2% | 3,559 | 11 |
| Ann Arbor | $407,250 | up 7.6% | 1,016 | 37 |
| Lansing | $216,500 | up 4.1% | 1,736 | 30 |
| Flint | $208,667 | up 2.9% | 1,428 | 23 |
| Kalamazoo | $275,167 | up 6.5% | 848 | 13 |
| Saginaw | $176,875 | up 8.6% | 615 | 19 |
| Traverse City | $434,633 | up 6.9% | 847 | 49 |
| Monroe | $251,233 | up 5.2% | 464 | 24 |
Source: Redfin Data Center metro level tracker, all residential, quarterly averages. Homes sold is the quarterly total.
The listing side: what sellers were asking
The numbers above are closed sales. The listing data shows what sellers were doing at the same time. Active listings averaged 21,119 in Q3 2024, up 23.2% from 17,147 a year earlier. The median asking price was $299,233, roughly $28,366 above the $270,867 median price homes actually sold for. An average of 8,484 listings per month took a price reduction during the quarter, up 36.9% year over year, and the median asking price per square foot was $181.
What this meant if you were selling
This was the quarter the easy market ended. Prices were still rising, but the bidding war share was falling and price cuts were spreading. Sellers who priced like it was spring got caught waiting. The full series lives at our Michigan housing market data hub, and if a traditional listing is not the right fit for your situation, we make cash offers on Michigan houses in any condition.
Sources and methodology
Sale side figures (median sale price, homes sold, days on market, months of supply, sale to list) are computed from the Redfin Data Center state and metro market trackers, all residential properties, not seasonally adjusted. Listing side figures (active listings, new listings, price reductions, asking price per square foot) come from Realtor.com residential listing data published via FRED, Federal Reserve Bank of St. Louis. Quarterly values are averages of the three monthly readings, except homes sold which is the quarterly sum. Data retrieved June 2026.