
Michigan Housing Market Report: Q2 2024
Sales, prices, inventory and days on market for April through June 2024, with comparisons to prior quarters. Published by Eric Roebuck, Offer Now Michigan. Updated June 2026.
I buy houses across Michigan, so I track these numbers every single week. Each quarter I pull the latest sales data from Redfin and the listing data that Realtor.com publishes through the St. Louis Fed, and I put it all in one place so you can see exactly where our market stands.
The Q2 2024 story: peak seller leverage
Spring 2024 was about as strong as a seller could hope for. The statewide median sale price jumped to $267,300, up 6.3% from $251,433 in spring 2023. A full 42% of Michigan homes sold above their asking price, and the average home brought in 99.9% of list.
Volume held up too. Just over 32,000 homes closed during the quarter, slightly ahead of the prior spring, and the typical home went under contract in about 22 days. Months of supply sat under 2, which is deep seller market territory.
Inventory had started rebuilding from the unusually thin spring of 2023, with active listings averaging 16,138, up 18.6% year over year. But demand absorbed it without blinking. Looking back, this quarter was the high water mark for seller leverage in this dataset.
Median sale price trend
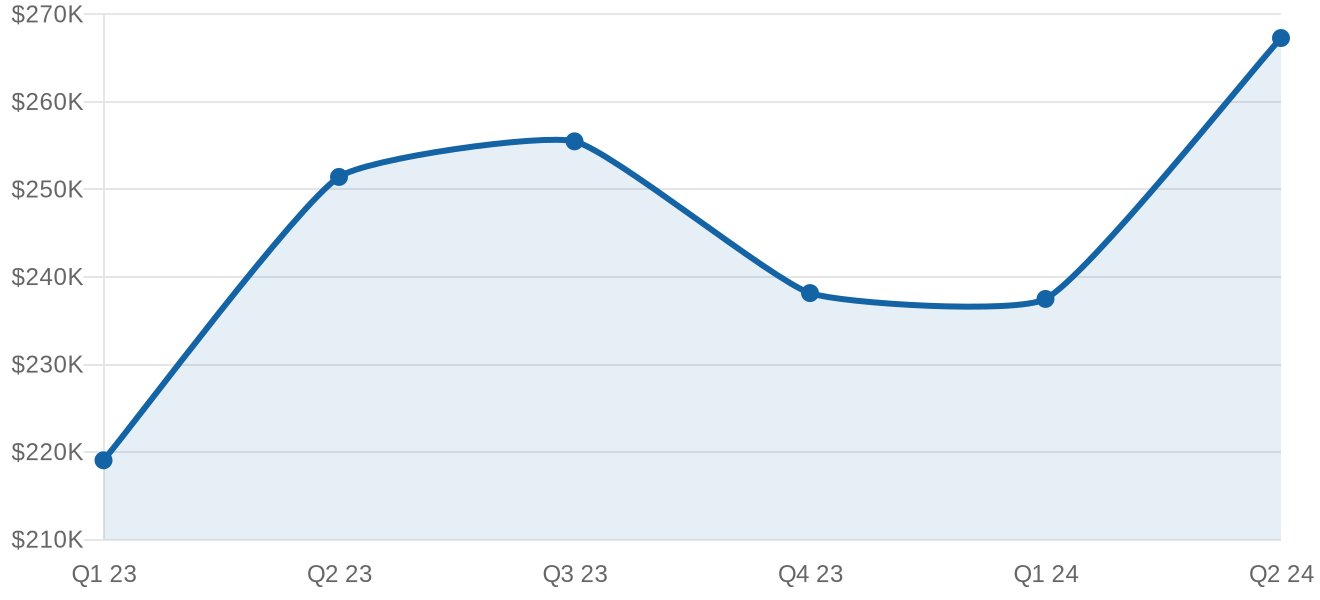
Statewide median sale price, all residential. Source: Redfin Data Center, quarterly average of monthly values.
Homes sold by quarter
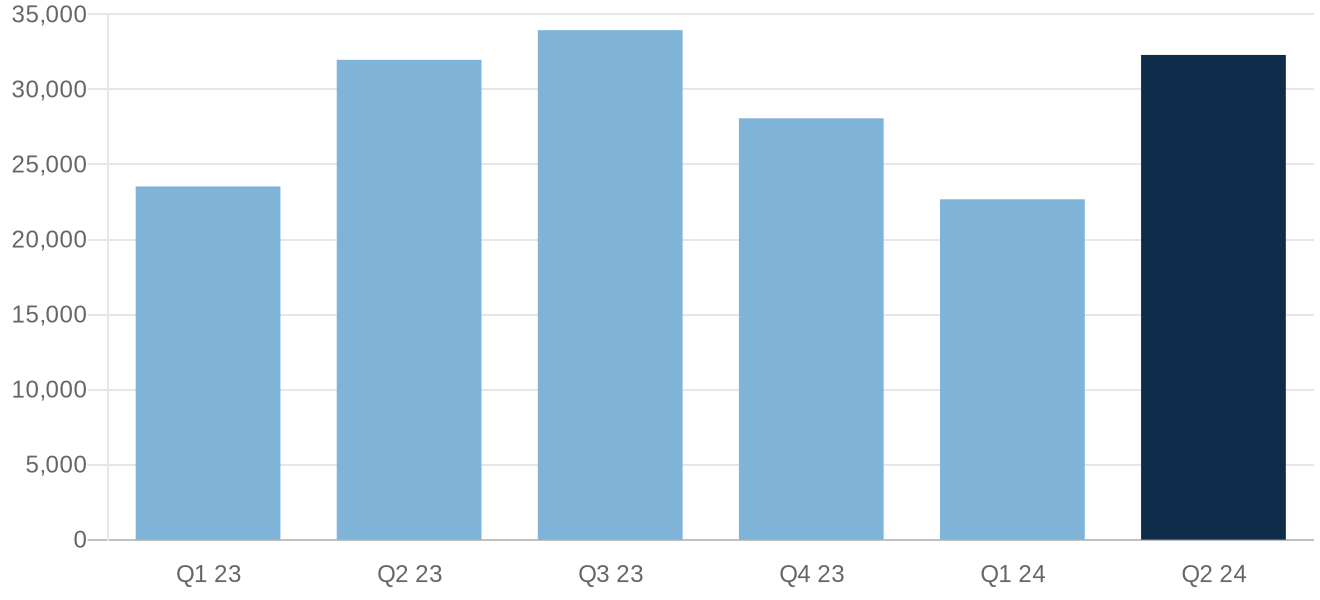
Total closed sales statewide per quarter. Source: Redfin Data Center.
Every metric, every quarter
| Quarter | Median sale price | Homes sold | Days on market | Months supply | Sold above list | Sale to list |
|---|---|---|---|---|---|---|
| Q1 2023 | $219,067 | 23,535 | 39 | 2.3 | 27.5% | 97.8% |
| Q2 2023 | $251,433 | 31,973 | 20 | 1.8 | 44.4% | 100.3% |
| Q3 2023 | $255,500 | 33,951 | 21 | 2.0 | 41.7% | 99.9% |
| Q4 2023 | $238,167 | 28,080 | 28 | 2.2 | 32.2% | 98.4% |
| Q1 2024 | $237,500 | 22,681 | 36 | 2.3 | 30.1% | 98.3% |
| Q2 2024 | $267,300 | 32,297 | 22 | 2.0 | 42.0% | 99.9% |
All residential properties, not seasonally adjusted. Price and ratio figures are quarterly averages of Redfin monthly data. Homes sold is the quarterly total.
How each Michigan metro did in Q2 2024
Here is how each metro I track performed during the quarter.
| Metro area | Median sale price | Change vs Q2 2023 | Homes sold | Days on market |
|---|---|---|---|---|
| Detroit | $196,333 | up 10.5% | 5,307 | 19 |
| Warren / Troy / Farmington Hills | $313,150 | up 6.4% | 8,876 | 13 |
| Grand Rapids | $344,275 | up 7.0% | 3,416 | 7 |
| Ann Arbor | $407,750 | up 3.0% | 1,119 | 30 |
| Lansing | $222,950 | up 9.6% | 1,752 | 25 |
| Flint | $212,917 | up 7.0% | 1,391 | 17 |
| Kalamazoo | $276,283 | up 7.3% | 800 | 11 |
| Saginaw | $169,333 | up 14.9% | 578 | 16 |
| Traverse City | $416,075 | up 4.9% | 744 | 42 |
| Monroe | $246,925 | up 7.6% | 459 | 25 |
Source: Redfin Data Center metro level tracker, all residential, quarterly averages. Homes sold is the quarterly total.
The listing side: what sellers were asking
The numbers above are closed sales. The listing data shows what sellers were doing at the same time. Active listings averaged 16,138 in Q2 2024, up 18.6% from 13,611 a year earlier. The median asking price was $296,600, roughly $29,300 above the $267,300 median price homes actually sold for. An average of 5,319 listings per month took a price reduction during the quarter, up 36.6% year over year, and the median asking price per square foot was $179.
What this meant if you were selling
Sellers held nearly all the cards in spring 2024. Clean houses moved in days with multiple offers, and even properties with issues found buyers faster than usual. If you compare these numbers to the quarters that followed, you can see why I tell people the market they remember from 2024 is not the market they are selling into today. I keep every quarter of this series updated at our Michigan housing market data hub, and if you ever want to skip the listing process, Offer Now Michigan buys houses across the state for cash.
Sources and methodology
Sale side figures (median sale price, homes sold, days on market, months of supply, sale to list) are computed from the Redfin Data Center state and metro market trackers, all residential properties, not seasonally adjusted. Listing side figures (active listings, new listings, price reductions, asking price per square foot) come from Realtor.com residential listing data published via FRED, Federal Reserve Bank of St. Louis. Quarterly values are averages of the three monthly readings, except homes sold which is the quarterly sum. Data retrieved June 2026.